The following analysis of the Central Washington real estate market is provided by Windermere Real Estate Chief Economist Matthew Gardner. We hope that this information may assist you with making better-informed real estate decisions. For further information about the housing market in your area, please don’t hesitate to contact me.
ECONOMIC OVERVIEW
The Washington State economy added 96,900 new jobs over the past 12 months, representing an annual growth rate of 2.9%—still solidly above the national rate of 1.5%. Most of the employment gains were in the private sector, which rose by 3.4%. The public sector saw a more modest increase of 1.6%.
The counties contained in this report added 1,616 new jobs over the past 12 months, which was a modest growth of 0.8%. The local unemployment rate for the area continued to fall, with a drop from 9% to 8%.
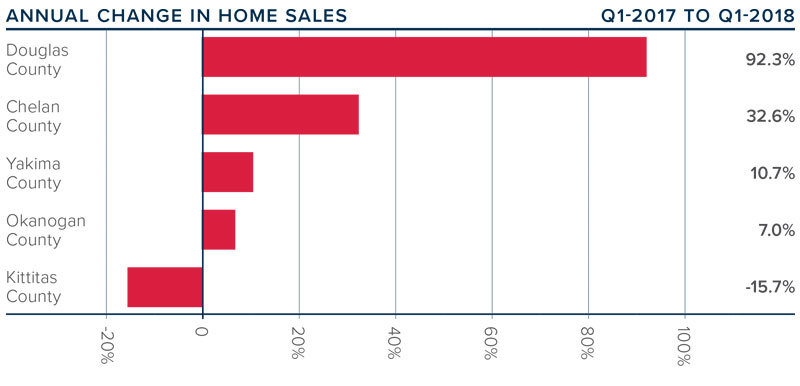
HOME SALES ACTIVITY
Home sales throughout Central Washington were generally higher in the first quarter of the year; four out of five counties saw growth in sales. In total, there were 859 home sales in the quarter—an increase of 13.5% from the same period in 2017.
Sales rose most in Douglas County, which almost doubled. That said, the actual number of sales only rose by 48. Sales fell in Kittitas County, but this was likely due to lack of inventory rather than lack of interest.
Demand for homes remained strong even as mortgage interest rates rose through the quarter. I do not expect that rising rates will impact sales until they breach the 5% barrier, but that is unlikely to happen until next year.
The lack of homes for sale remains an issue, but I am optimistic that inventory levels will rise modestly as we move toward the summer.
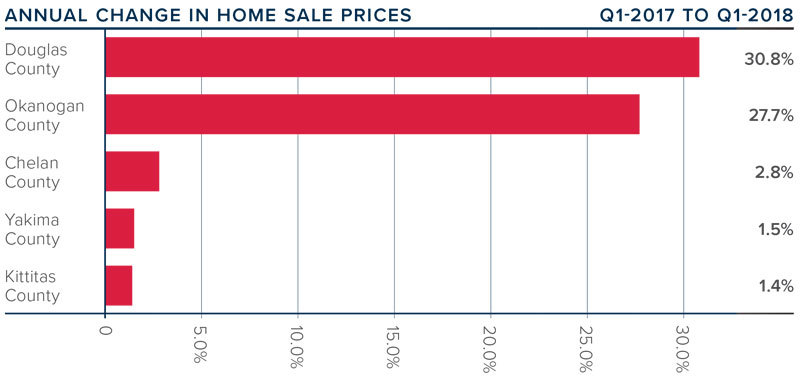
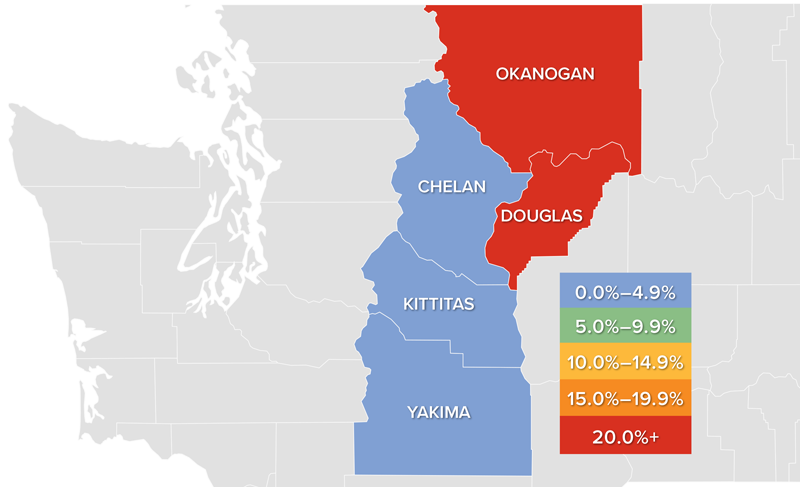
HOME PRICES
Year-over-year, the average home price in the region rose 6.3% to $291,728. Price growth picked back up in the first quarter and remains well above the long-term average as demand continues to exceed supply.
Chelan, Yakima, and Kittitas Counties saw relatively modest price contractions. I believe this is due to seasonality, and it is not a cause for concern at the present time.
All five counties in this report saw prices rise compared to the fourth quarter of 2017. Douglas and Okanogan Counties stood out with very substantial increases. This is largely due to the fact that they are both relatively small markets and, therefore, can see large swings in sale prices.
Home-price growth continues to increase at above-average rates due to supply constraints. I expect this trend to continue through the duration of 2018.
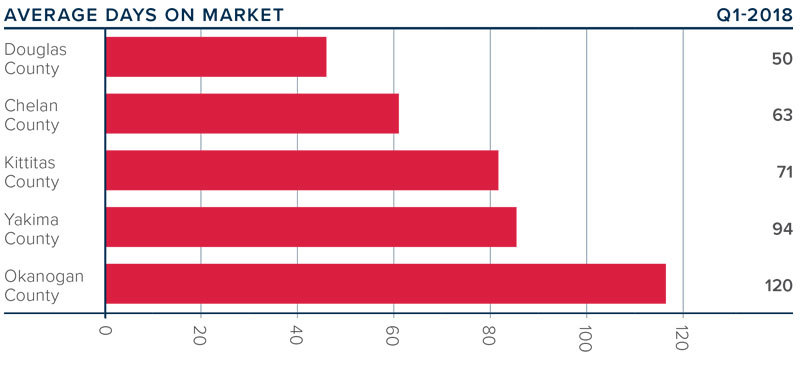
DAYS ON MARKET
The average number of days it took to sell a home dropped nine days compared to the first quarter of 2017.
The average time it took to sell a home in the region was 79 days, down four days compared to the fourth quarter of 2017.
All the markets contained in this report, other than Chelan, saw days-on-market drop from the same quarter in 2017.
Homes sold fastest in Douglas County, where it took an average of 50 days to sell a home. The greatest drop in days on market was in Kittitas County, at 22 fewer days than in the fourth quarter of last year.
CONCLUSIONS
This speedometer reflects the state of the region’s housing market using housing inventory, price gains, home sales, interest rates, and larger economic factors. For the first quarter of 2018, I held the needle at the same position as last quarter. The market still favors sellers, but supply is improving—albeit modestly.